Data Analysis
CNC Surface Roughness Analysis
Statistical Analysis & Surface Roughness Prediction
- CNC Machining
- Data Analysis
- Regression
- Statistics
- Python
- Scikit-learn
Observations
324
Test R²
0.620
CV R²
0.579
CV MAE / RMSE
0.160 / 0.214
Project Overview
This project analysed 324 CNC machining observations to investigate the relationship between machining parameters and surface roughness. The analysis used correlation analysis, multiple linear regression, and model validation to understand how machining parameters influence surface roughness (Ra) and to develop a predictive regression model.
- Machining parameters such as spindle speed, feed rate, and depth of cut were examined for their relationship with surface roughness (Ra).
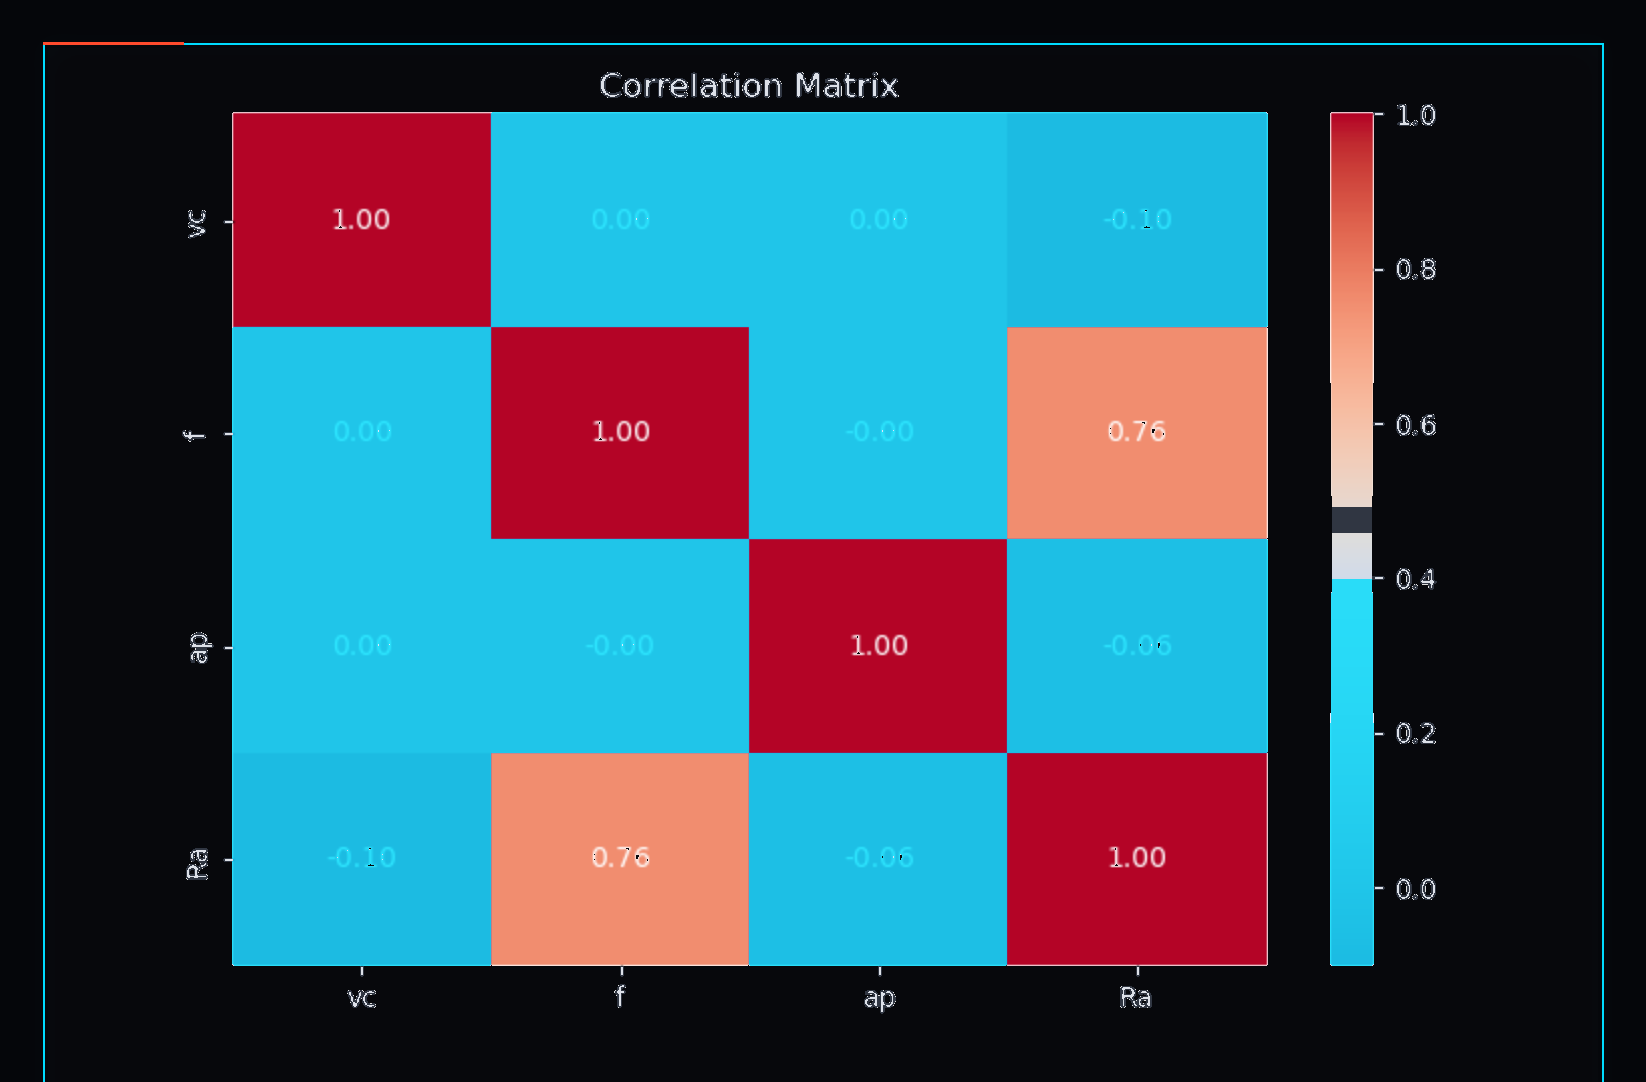
- Correlation analysis was used to identify and quantify relationships between the machining parameters and surface roughness.
- A multiple linear regression model was developed to predict surface roughness from the selected machining parameters.
Dataset
Scale
324 CNC machining observations.
Target
Surface roughness (Ra) as a function of machining parameters.
Exploratory & Correlation Analysis
- Computed pairwise correlations between machining parameters and the surface roughness target variable.
- Examined the strength and direction of relationships to understand which parameters most influence surface roughness.
- Used correlation findings to inform feature selection for the regression model.
Regression Model
- Trained a multiple linear regression model on the machining dataset (324 observations).
- Evaluated model performance on a held-out test set, achieving a test R² of 0.620.
- Assessed the model's ability to generalise by interpreting the R² value in the context of machining variability.
Model Validation
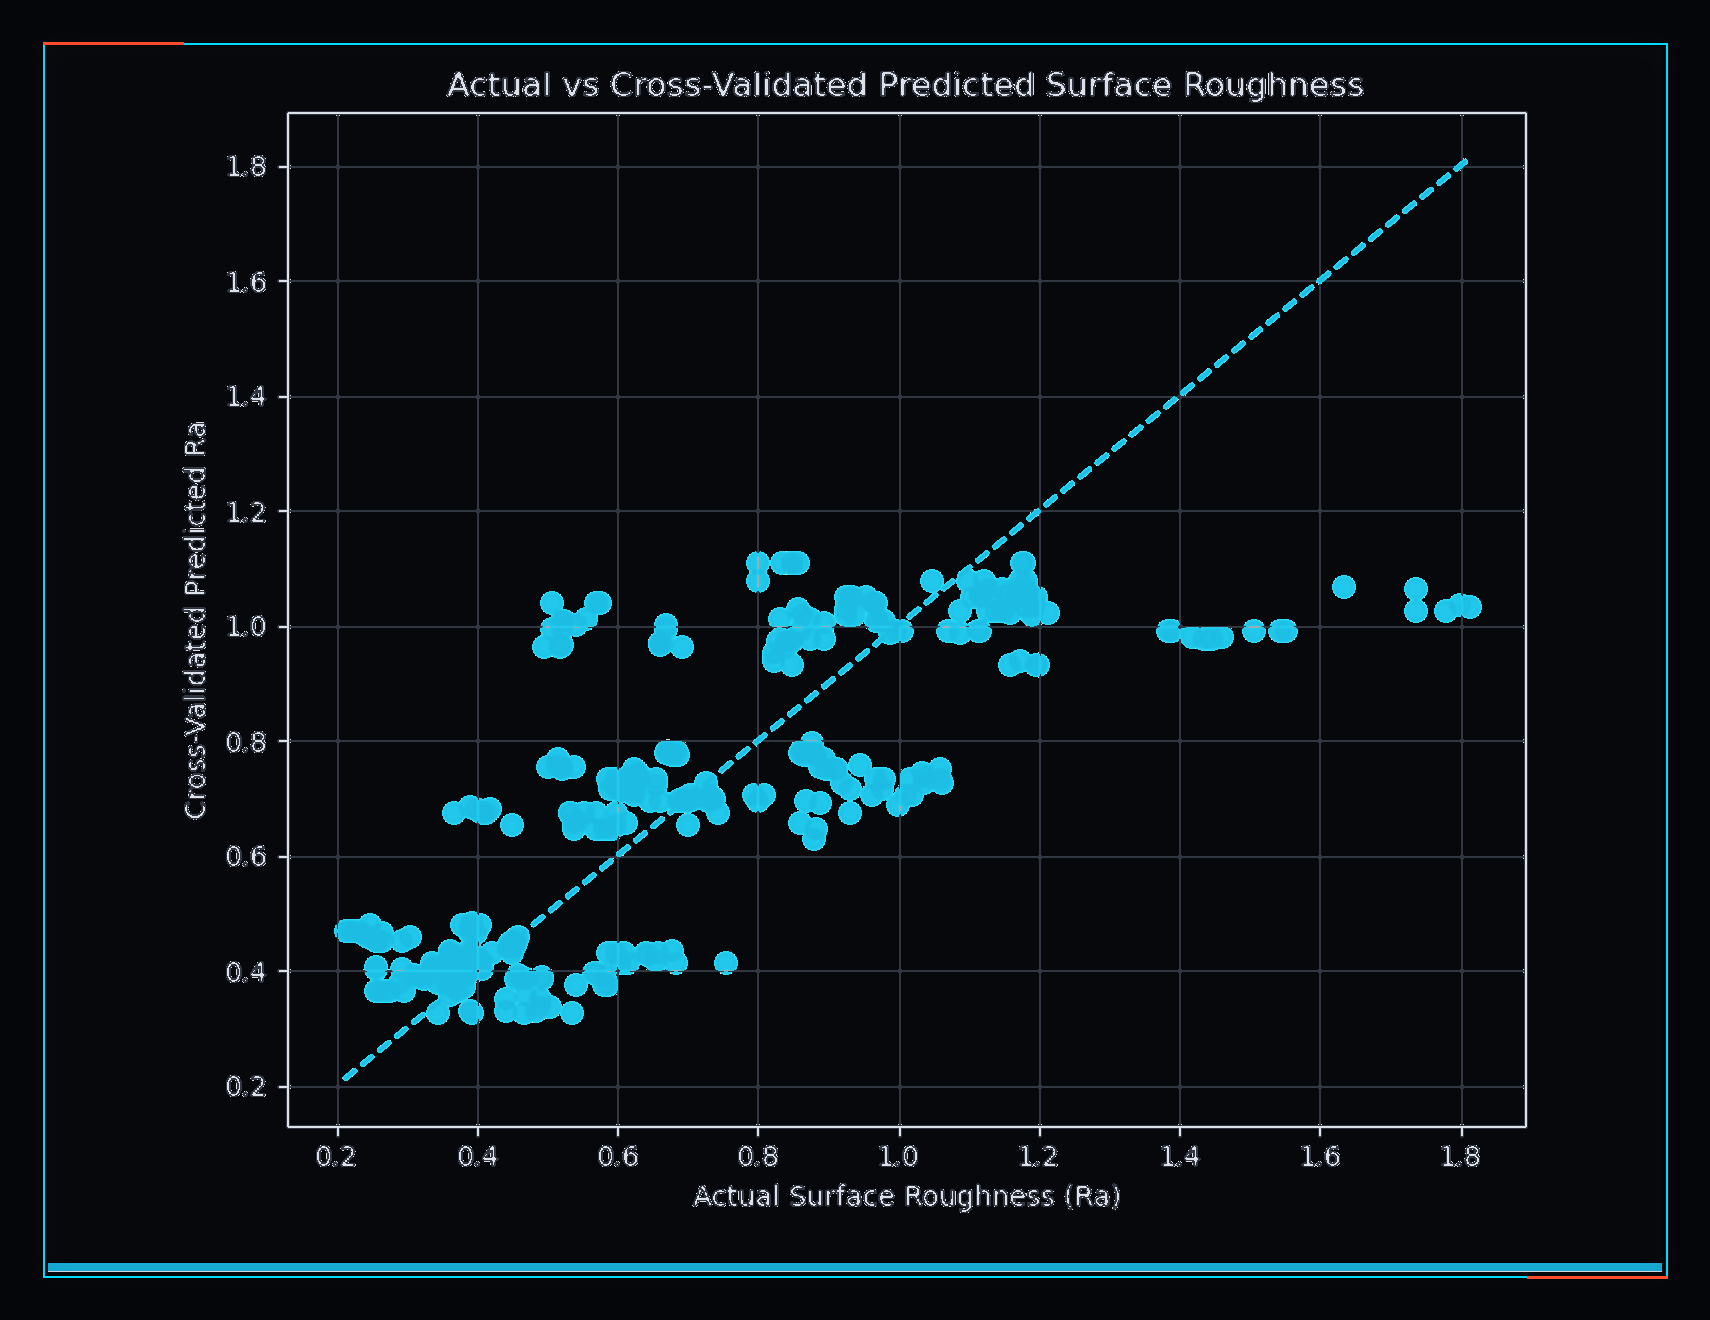
- Applied 5-fold cross-validation to assess model stability across different data splits.
- 5-fold cross-validation R² of 0.579, MAE of 0.160, and RMSE of 0.214.
- Compared test R² and cross-validation R² to check for overfitting or data-split sensitivity.
Residual Analysis
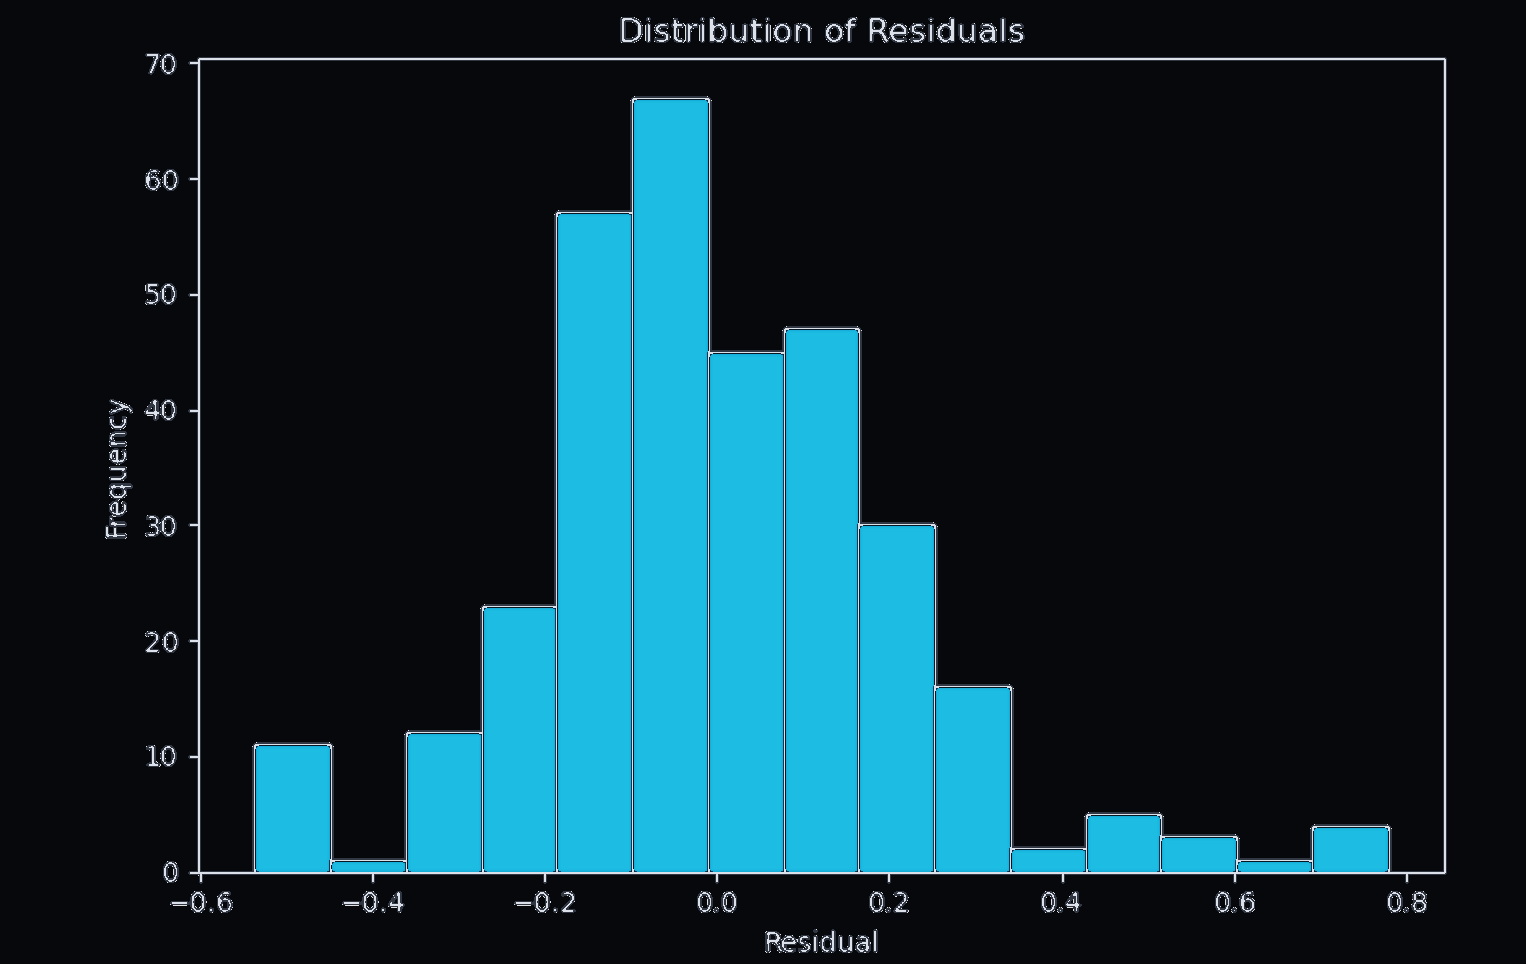
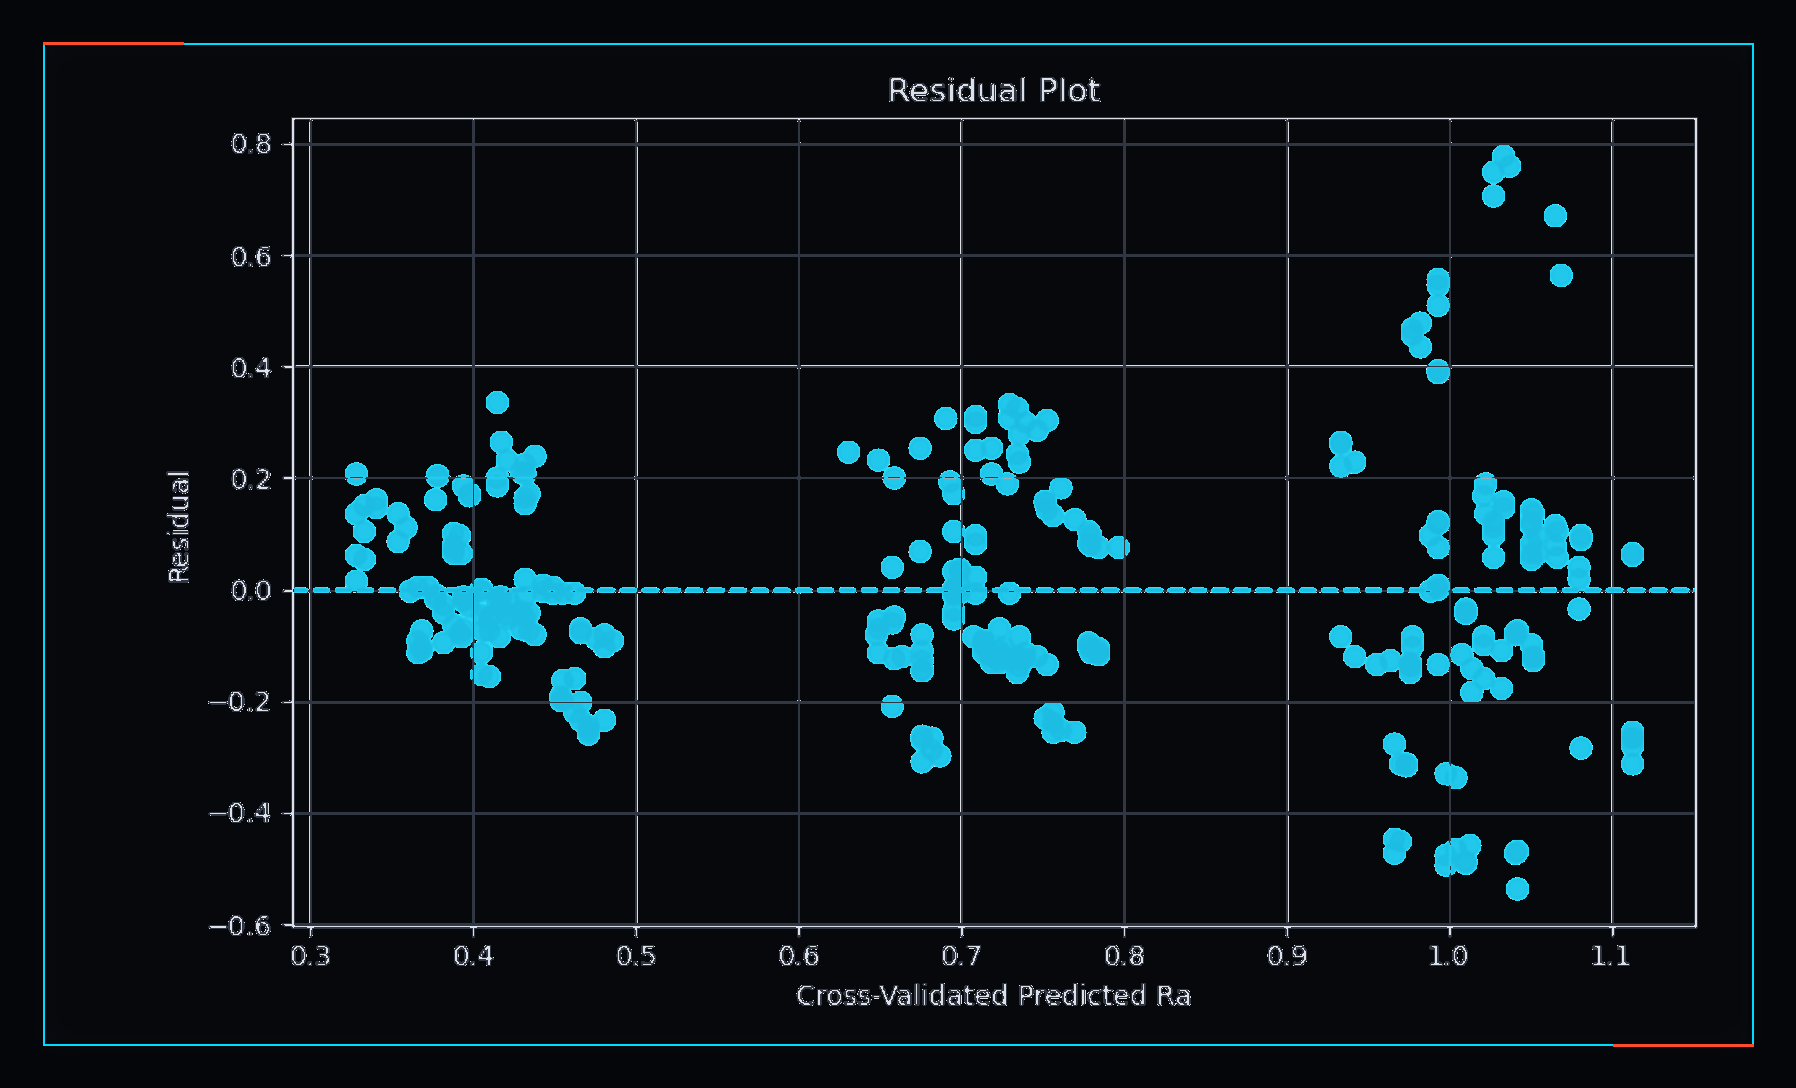
- Examined the distribution of residuals (prediction errors) to assess model fit assumptions.
- Residual analysis supported evaluation of linearity, homoscedasticity, and error patterns.
Computational Outputs
 Loading image…
 Loading image…
 Loading image…
 Loading image…
Key Findings
- The multiple linear regression model achieved a test R² of 0.620, explaining a moderate proportion of variance in surface roughness.
- 5-fold cross-validation R² of 0.579, MAE of 0.160, and RMSE of 0.214 confirmed consistent generalisation across data splits.
- Correlation analysis provided a structured view of how individual machining parameters relate to surface roughness.
- The relatively close test and cross-validation R² values suggest the model did not overfit to the training data.